How Do Americans Spend Their Time in an Average Day?
By Anna Green

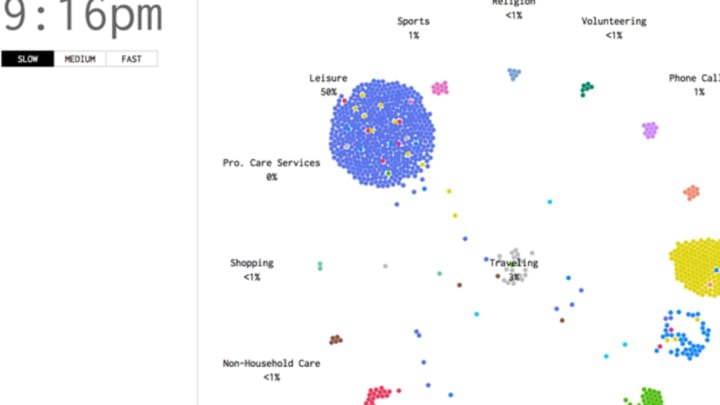
Ever wonder what most Americans are doing at 4:01 A.M.? Or what a typical day looks like for people across the United States? Statistician Nathan Yau of Flowing Data created a visualization to answer those questions and more. Using data from the 2004 American Time Use Survey, Yau designed a simulation of an average 24 hours in the lives of 1000 Americans.
The simulation is broken down by the minute, which provides a phenomenal amount of specificity about what activities people engage in at different times. Colorful dots representing individual survey participants move from activity to activity as the clock counts out a day; at the same time, percentages listed beneath each category (work, education, eating, and sleeping to name a few) show exactly what proportion of Americans are engaged in an activity at a given time.
While much of Yau’s data is unsurprising—the majority of Americans work during the day, relax in the evening, and sleep at night—it’s interesting to note the amount of variation that still exists in people’s lives. Even if 95 percent of Americans are asleep at 3:30 A.M., for instance, there’s always someone up and eating a snack (<1 percent), engaging in a leisure activity (1 percent), or pulling a late night at work (2 percent).
Yau explains, “Following the timeline of the ATUS, the simulation starts at 4:00 a.m. and runs through 24 hours. The day starts with little movement as people are asleep and won't wake up for a few hours. For most, the day starts at 7:00 a.m. and then it's off to the races (which is especially fun to see on the fast speed).”
Check out Yau’s mesmerizing simulation, and learn more about his methodology, here.
[h/t: Gizmodo]