%20%20--%3E%0A%3Csvg%20version%3D%221.1%22%20id%3D%22Layer_1%22%20xmlns%3D%22http%3A%2F%2Fwww.w3.org%2F2000%2Fsvg%22%20xmlns%3Axlink%3D%22http%3A%2F%2Fwww.w3.org%2F1999%2Fxlink%22%20x%3D%220px%22%20y%3D%220px%22%0A%09%20viewBox%3D%220%200%20684.6%2068.1%22%20style%3D%22enable-background%3Anew%200%200%20684.6%2068.1%3B%22%20xml%3Aspace%3D%22preserve%22%3E%0A%3Cg%3E%0A%09%3Cpath%20d%3D%22M444.1%2C29.3h-17.4v14.5h17.4V29.3z%20M36.4%2C68.1l29.3-50.8V0H50.4L32.9%2C36.8L15.5%2C0H0v68.1h16.7V45.8l12.4%2C22.3H36.4z%0A%09%09%20M49.1%2C68.1h16.6V23.4L49.1%2C52.1V68.1z%20M76.6%2C68.1h45V53.8H93.3V41.6h21V27.1h-21V14.8h28.3V0.1h-45V68.1z%20M175.6%2C68.1h17.3v-68%0A%09%09h-16.5v40.3L150%2C0.1h-17.6v68h16.7V27.7L175.6%2C68.1z%20M235.8%2C14.8h15.4V0.1h-47.4v14.7H219v53.2h16.8V14.8z%20M290.3%2C45.9h-17.1%0A%09%09l7.5-15.6h2L290.3%2C45.9z%20M298.7%2C68.1h18l-32.2-68h-5.7l-32%2C68h18l3.3-7.1h27.1L298.7%2C68.1z%20M325.2%2C68.1h46.2V53.8h-29.6V0.1h-16.7%0A%09%09V68.1z%20M423.7%2C14.8h27.2V0.1H407v68h16.7V14.8z%20M462%2C68.1h46.2V53.8h-29.6V0.1H462V68.1z%20M564.8%2C34.1c0%2C10.7-7.2%2C19.2-18.5%2C19.2%0A%09%09c-11.4%2C0-18.5-8.5-18.5-19.2s7.1-19.2%2C18.5-19.2C557.6%2C14.9%2C564.8%2C23.4%2C564.8%2C34.1%20M580.6%2C34.1c0-19-14.2-34-34.3-34%0A%09%09c-20.2%2C0-34.3%2C15-34.3%2C34c0%2C19%2C14.1%2C34%2C34.3%2C34C566.4%2C68.1%2C580.6%2C53.1%2C580.6%2C34.1%20M604.8%2C20.5c0-4.1%2C3.3-6.2%2C6.7-6.2%0A%09%09c4.4%2C0%2C6.6%2C3%2C6.6%2C6.6h14.7C631.8%2C9.1%2C625.1%2C0.1%2C611%2C0.1c-12%2C0-21.7%2C9.3-21.7%2C20.6c0%2C10.9%2C5.9%2C15.9%2C16.7%2C19.8%0A%09%09c5.2%2C1.8%2C11.5%2C3.2%2C11.5%2C8c0%2C3.3-2.4%2C5.5-6.4%2C5.5c-3.6%2C0-6.6-3-6.6-6.7h-15.2c0%2C11.5%2C7.9%2C20.8%2C21.8%2C20.8c12%2C0%2C21.6-9.3%2C21.6-20.6%0A%09%09c0-10-5.3-16.4-16.7-19.8C610.6%2C26.1%2C604.8%2C25.3%2C604.8%2C20.5%20M670%2C20.9h14.7C683.8%2C9.1%2C677.1%2C0.1%2C663%2C0.1c-12%2C0-21.7%2C9.3-21.7%2C20.6%0A%09%09c0%2C10.9%2C5.9%2C15.9%2C16.7%2C19.8c5.2%2C1.8%2C11.5%2C3.2%2C11.5%2C8c0%2C3.3-2.4%2C5.5-6.4%2C5.5c-3.6%2C0-6.6-3-6.6-6.7h-15.2c0%2C11.5%2C7.9%2C20.8%2C21.8%2C20.8%0A%09%09c12%2C0%2C21.6-9.3%2C21.6-20.6c0-10-5.3-16.4-16.7-19.8c-5.4-1.6-11.3-2.4-11.3-7.2c0-4.1%2C3.3-6.2%2C6.7-6.2C667.7%2C14.4%2C670%2C17.3%2C670%2C20.9%0A%09%09%22%2F%3E%0A%3C%2Fg%3E%0A%3C%2Fsvg%3E%0A)

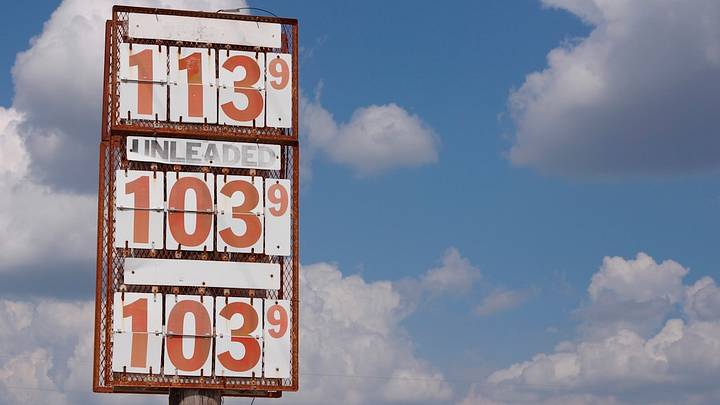
Gas prices seem to have gone up so much that even the most responsible drivers have considered cutting it close to the "Low Fuel" alert before heading to the station.
Watching the numbers multiply on the pump meter is a special kind of pain, but context is everything. Back in 1956, gas was a mere 30 cents a gallon. That sounds like a steal until you run it through an inflation calculator: in today's dollars, that gallon cost $3.69. Fast-forward through the 1970s energy crisis, the 2008 economic collapse, and recent market shocks from the Russia-Ukraine war and Middle East conflict, and by September 2026, AAA placed the average price of a gallon at approximately $4.44.
Of course, national numbers tell only a fraction of the full tank's story. State tax rates, environmental rules, and shipping distances mean a driver in California routinely pays more than someone filling up in Texas. Nonetheless, the data on average annual retail fuel prices used for this list come from the U.S. Department of Energy and the U.S. Energy Information Administration, with historical figures adjusted to 2026 dollars.
Whether you were born when gas cost pocket change or during a historic price spike, here’s a look at what a gallon of gas cost the year you arrived, and what it really meant for your parents’ wallets.
The Average Cost of a Gallon of Gas the Year You Were Born
1955
29 cents
$3.62 (in 2026 dollars)

1956
30 cents
$3.69 (in 2026 dollars)
1957
31 cents
$3.70 (in 2026 dollars)
1958
30 cents
$3.48 (in 2026 dollars)
1959
31 cents
$3.57 (in 2026 dollars)
1960
31 cents
$3.51 (in 2026 dollars)
1961
31 cents
$3.47 (in 2026 dollars)
1962
31 cents
$3.44 (in 2026 dollars)
1963
30 cents
$3.28 (in 2026 dollars)
1964
30 cents
$3.24 (in 2026 dollars)
1965
31 cents
$3.30 (in 2026 dollars)

1966
32 cents
$3.31 (in 2026 dollars)
1967
33 cents
$3.31 (in 2026 dollars)
1968
34 cents
$3.27 (in 2026 dollars)
1969
35 cents
$3.19 (in 2026 dollars)
1970
36 cents
$3.11 (in 2026 dollars)
1971
36 cents
$2.98 (in 2026 dollars)
1972
36 cents
$2.88 (in 2026 dollars)
1973
39 cents
$2.94 (in 2026 dollars)
1974
53 cents
$3.60 (in 2026 dollars)
1975
57 cents
$3.55 (in 2026 dollars)

1976
61 cents
$3.59 (in 2026 dollars)
1977
66 cents
$3.65 (in 2026 dollars)
1978
67 cents
$3.44 (in 2026 dollars)
1979
90 cents
$4.15 (in 2026 dollars)
1980
$1.25
$5.08 (in 2026 dollars)
1981
$1.38
$5.09 (in 2026 dollars)
1982
$1.30
$4.51 (in 2026 dollars)
1983
$1.24
$4.17 (in 2026 dollars)
1984
$1.21
$3.90 (in 2026 dollars)
1985
$1.20
$3.74 (in 2026 dollars)

1986
93 cents
$2.84 (in 2026 dollars)
1987
95 cents
$2.80 (in 2026 dollars)
1988
95 cents
$2.69 (in 2026 dollars)
1989
$1.02
$2.76 (in 2026 dollars)
1990
$1.16
$2.97 (in 2026 dollars)
1991
$1.14
$2.80 (in 2026 dollars)
1992
$1.13
$2.70 (in 2026 dollars)
1993
$1.11
$2.57 (in 2026 dollars)
1994
$1.11
$2.51 (in 2026 dollars)
1995
$1.15
$2.53 (in 2026 dollars)

1996
$1.23
$2.63 (in 2026 dollars)
1997
$1.23
$2.57 (in 2026 dollars)
1998
$1.06
$2.18 (in 2026 dollars)
1999
$1.17
$2.35 (in 2026 dollars)
2000
$1.51
$2.94 (in 2026 dollars)
2001
$1.46
$2.76 (in 2026 dollars)
2002
$1.36
$2.53 (in 2026 dollars)
2003
$1.59
$2.89 (in 2026 dollars)
2004
$1.88
$3.33 (in 2026 dollars)
2005
$2.30
$3.94 (in 2026 dollars)

2006
$2.59
$4.30 (in 2026 dollars)
2007
$2.80
$4.52 (in 2026 dollars)
2008
$3.27
$5.09 (in 2026 dollars)
2009
$2.35
$3.67 (in 2026 dollars)
2010
$2.79
$4.29 (in 2026 dollars)
2011
$3.53
$5.26 (in 2026 dollars)
2012
$3.64
$5.31 (in 2026 dollars)
2013
$3.53
$5.08 (in 2026 dollars)
2014
$3.37
$4.77 (in 2026 dollars)
2015
$2.45
$3.46 (in 2026 dollars)

2016
$2.14
$2.99 (in 2026 dollars)
2017
$2.41
$3.29 (in 2026 dollars)
2018
$2.74
$3.66 (in 2026 dollars)
2019
$2.64
$3.46 (in 2026 dollars)
2020
$2.17
$2.81 (in 2026 dollars)
2021
$3.05
$3.77 (in 2026 dollars)
2022
$4.09
$4.68 (in 2026 dollars)
2023
$3.50
$3.85 (in 2026 dollars)
2024
$3.30
$3.52 (in 2026 dollars)
2025
$3.10
$3.23 (in 2026 dollars)
