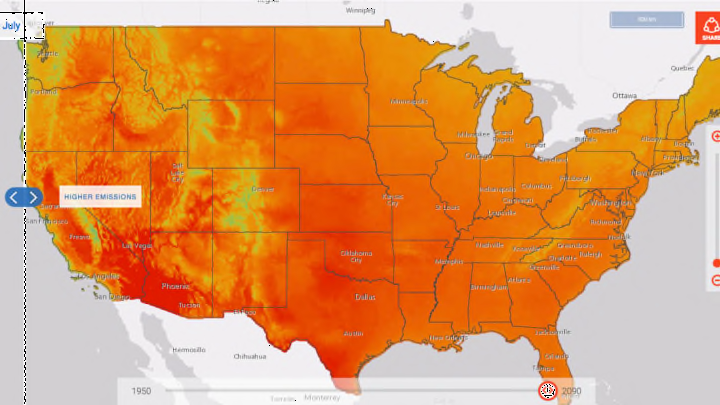
In the next century, researchers predict that climate change will have far-reaching effects on everything from sea levels to wine production. And while the majority of Americans believe climate change will be bad for the country, fewer believe it will have a negative impact on their own lives. A new interactive tool called Climate Explorer from the National Oceanic and Atmospheric Administration (NOAA) breaks down the issue to the personal level.
As Futurism reports, Climate Explorer charts nearly a century of projected climate trends through a series of maps and graphs. Residents of Southern California, for example, can type in their city, county, or zip code to see what temperature highs will look like in their neighborhood 73 years down the road. Between 1981 and 2000, Los Angeles saw a yearly average of six days that exceeded 95°F. Low estimates for 2090 put that number between 40 and 70 days of extreme heat.

Southern states aren’t the only places that face extreme changes in the coming decades. Cities accustomed to cooler climates like Boston and Chicago will also see their heat waves grow exponentially. See the outlook for Suffolk County, which Boston is in:

NOAA’s tool also charts data for precipitation trends and heating and cooling degree days, a metric used to look at energy consumption. After checking out the forecast for your neck of the woods, scroll down to the bottom of the page to explore local weather station data from the past 30 years.
[h/t Futurism]
