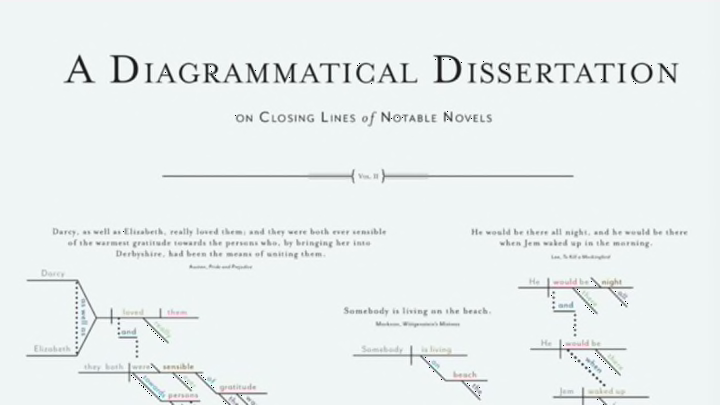
If it exists, you should chart it. That’s the motto of Pop Chart Lab, the Brooklyn-based creative team whose mission is to deconstruct “all of human experience” into visually compelling infographics.
Last year, Pop Chart Lab created a poster that diagrams the opening sentence of 25 classic novels using the Reed-Kellogg method. Now, they’ve shifted their grammatical gaze toward closing sentences, which are apparently “just as hard to diagram as opening sentences”—but for their own distinct reasons.
“The grammar tends to be different: for starters, they’re riddled with pronouns, since the characters in the book have been well established by the final page,” the team said. “So proper names and groups are often converted to 'he,' 'she,' 'we,' 'they,' etc. This can complicate grammar-parsing, as the true subject of the sentence becomes foggy. Who is ‘HE?’ Just how many people comprise ‘THEY?’ Reading the sentences outside the context of the complete book makes person identification really tough.”
Aside from parsing the sentences’ technical nuts and bolts, readers can also appreciate the sheer variety of options authors are faced with while brainstorming the perfect close. Do they use long, languorous sentences filled with poetic turns of phrase? Or do they opt for pithy sentiments and perfunctory prose? There's no "right" or "wrong" way to wrap up a novel—and these diagrams, the Pop Chart Lab team says, are “like little peeks under the motherboard at the circuitry of good writing.”
