Every star you’ve ever seen in the night sky with your naked eye is part of our galaxy, the Milky Way. Some of these stars have been around for many billions of years (the Sun is about 4.57 billion years old), while some of them are only a few million years old. Now for the first time, scientists are getting a better idea of how exactly the galaxy has aged, with a new map that shows how old individual stars are.
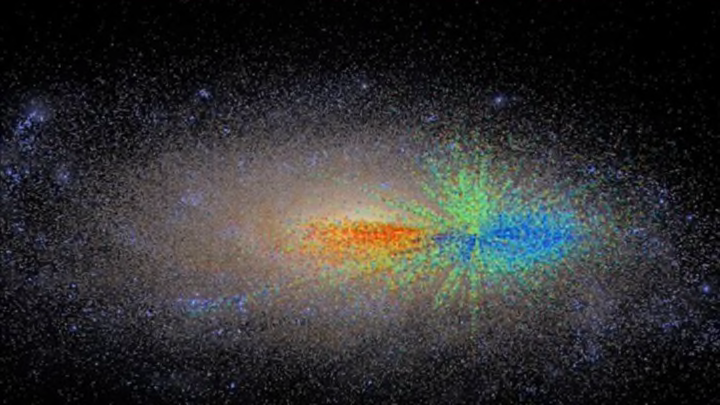
Researchers from the Max Planck Institute for Astronomy have used data on the wavelengths of light emitted from different stars observed at the Apache Point Observatory in New Mexico and NASA's Kepler Space Telescope to map out the age of various celestial bodies in the Milky Way, giving us clues about how the galaxy has changed over time. The map visualizes the ages of about 100,000 red giant stars, with the youngest stars shown in blue, the oldest in red, and those in-between in green. (As all the mapped stars are red giants, that means they’re in the relatively late stages of stellar evolution. Stars can remain red giants for up to a billion years.)
Previously, researchers were only able to map the ages of stars relatively close to our own, up to a distance of 330 light-years away. The new map shows stars extending about 65,000 light-years from the galaxy’s center, though it's still only one radial section of the spiral Milky Way.
The oldest stars are clustered in the center of the galaxy, confirming previous models that contend that the galaxy grew from a smaller disc, expanding outward as new stars were born. This map uses new methods of dating stars made possible by satellites that can sense the tiniest of variations in a star’s brightness, allowing scientists to figure out a star’s age just by the spectrum of color it emits. From that data, researchers can estimate a red giant’s mass, and from that, its age, allowing us to expand our knowledge of the galaxy’s lengthy history.
