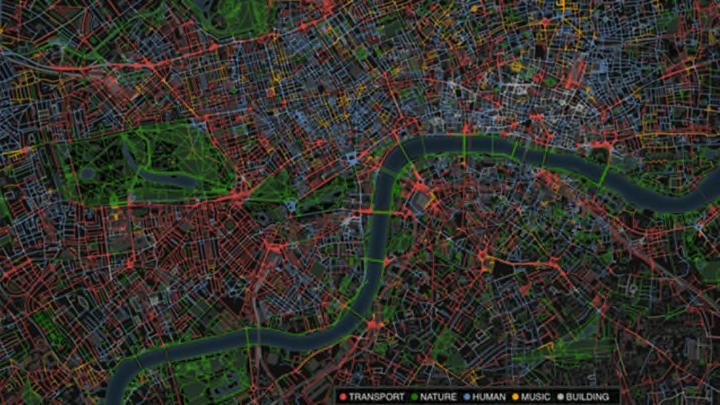
Sounds are a huge part of the urban experience. The rumbling and honking of traffic, the chatter of pedestrians, and the sounds of street musicians are just a few of the aural experiences we associate with big cities. A new project called Chatty Maps renders street sounds in major global cities visible, block by block, showing the percentage of sounds that came from different categories of sources.
Created by the urban data research group Good City Life—which has also made maps for other vital city experiences, like smells—Chatty Maps graphs the spread of sounds from vehicles, people, music, nature, and buildings (think showers running or toilets flushing) throughout a handful of global cities like London, Barcelona, Rome, New York, and Miami. You can filter the map by different sounds to see where traffic-related noise is particularly strong or music takes over the streetscape.
The data comes from social media, where people say a surprising amount about the noises around them—if you’re looking at it the right way. The researchers created an “urban sound dictionary” that classifies the words mentioned in geotagged images on Flickr, such as “motorcycle,” “barking,” or “laughing.”

New York City
On London’s Camden High Street, a short stretch of road bookended by music venues, more than 66 percent of street noise is music. On New York City’s iconic Brooklyn Bridge, a popular pedestrian pathway, the sounds are 37 percent human, 33 percent nature, and 25 percent transport. On the National Mall in Washington D.C., the sounds are mostly natural.

Barcelona
The researchers compared the sounds of different streets with the types of emotions people usually expressed while posting pictures, like anger or joy. Because while urban planners are mostly interested in the ways that sound can detract from people’s lives—keeping them awake at night, for instance—it can also bring people joy, depending on the noise. People generally enjoy hearing music (at certain hours) or listening to the birds. "Urban sound is not only annoying but can also be soothing, exhilarating, saddening, and surprising,” the researchers write in a press release [PDF].
But drawing on social media for data can have its drawbacks. People don’t typically post photos to Flickr every time they’re disturbed by a jackhammer or hear a plane rocketing by. They’re much more likely to post a photo of a noisy parade or a street musician playing on the corner. Thus, the maps may not always show the full picture. For instance, when I looked up my notably noisy Brooklyn street, its noises were classified as nearly 50 percent nature—though from lived experience, I wonder if they’re classifying train horns and loud music from cars as part of the natural environment. More tourist-oriented areas, where lots of people post photos, may contain more accurate data than residential streets or far-flung neighborhoods.
There are 12 cities mapped so far, with more on the way.
[h/t Wired]
All images via Good City Life
