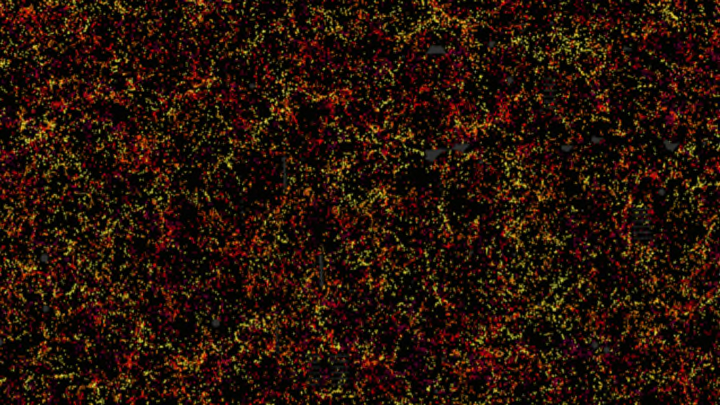
To us, the image above may look like a mess—perhaps the product of a bored person playing around in Microsoft Paint. To the trained eye, it contains multitudes: 48,741 galaxies, to be exact. And what we see here is just 3 percent of the big picture: the largest-ever map of the effects of dark energy on our universe.
Measuring objects on Earth is typically a straightforward process. We can put something on a scale and see how much it weighs, or pull out a tape measure to determine its height, width and depth. But objects in space are a very different story. The distance between our eyes and the stars is so great that it adds another dimension: time. By accounting for this time, scientists can understand not only what’s going on in space now, but everything that has come before.
One way to do that is to track baryon acoustic oscillations (BAO), or consistently sized variations in the density of visible normal (baryonic) matter. These variations work much like the inch lines on a ruler, allowing scientists to effectively measure distances. Comparing the distances between and distribution of galaxies over time essentially creates a time-lapse image that shows how, moment by moment, eon over eon, dark matter and energy are pushing apart our universe.
Capturing this information is a massive undertaking. Hundreds of astronomers and physicists joined forces to convert BAO data from the Sloan Digital Sky Survey-III’s Baryon Oscillation Spectroscopic Survey (BOSS) program. They collected measurements on more than 1.2 million galaxies over one quarter of the sky, resulting in a 3D map depicting 650 cubic billion light years.

A 2D image of the sky (left) transformed into a 3D map including 120,000 galaxies—just 10 percent of the survey area. Image credit: Jeremy Tinker and SDSS-III
David Schlegel is an astrophysicist at Lawrence Berkeley National Laboratory and a BOSS principal investigator. He and his colleagues are very proud of their work. “We’ve made the largest map for studying the 95 percent of the universe that is dark,” he said in a press statement. “In this map, we can see galaxies being gravitationally pulled towards other galaxies by dark matter. And on much larger scales, we see the effect of dark energy ripping the universe apart.”
A suite of papers on the map’s creation and contents has been submitted to the Monthly Notices of the Royal Astronomical Society.
Know of something you think we should cover? Email us at tips@mentalfloss.com.
