Back in 1900, the average global life expectancy was just 32 years. Today, it’s more than doubled to just over 73 years (with an average six-year increase in life expectancy around the world recorded in the first two decades of the 21st century alone).
Not all countries and regions fare quite as well as others, of course. Globally, the likes of Monaco (86.5 years), San Marino (85.8), Hong Kong (85.6), and Japan (84.8) have the highest life expectancies, while Nigeria (54.6), Chad (55.2), the Central African Republic (57.7), and South Sudan (57.7) are ranked at the bottom. Oceania has recently joined Europe as the continent with the highest average life expectancy (79.1), while in Africa, the figure is 63.8.
The United States, meanwhile, has an average life expectancy of 78.4, according to the latest U.S. Centers for Disease Control and Prevention figures—but even inside the U.S., the story is very different from one state to the next, as a new analysis by the data website USA Facts shows.
- How Life Expectancy Is Calculated
- The States with the Highest and Lowest Life Expectancies
- Life Expectancy by State from Lowest to Highest
How Life Expectancy Is Calculated
The study’s data is based on the latest figures from the CDC, which calculates its life expectancy statistics based on the age-specific death rates reported in a particular year. That means that life expectancy isn’t the same as a state or country’s death rate (i.e. the proportion of people who died in a particular year), nor is it just the average age at death in a country (which is the figure averaged from all yearly reported deaths). Instead, life expectancy is defined as the predicted average age at death for someone born today.
The States with the Highest and Lowest Life Expectancies

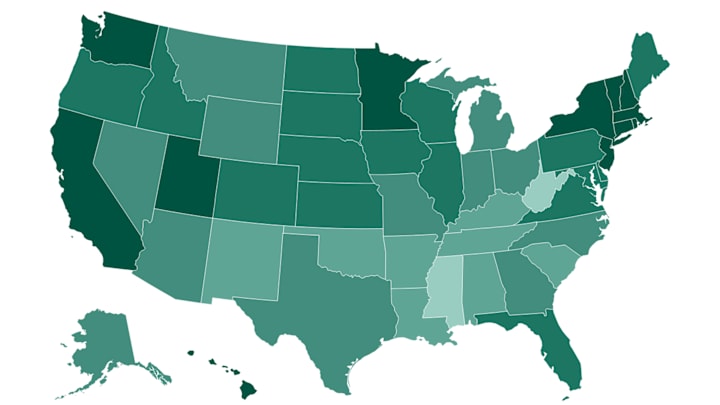
The study found that the state with the highest average life expectancy at birth in the U.S. is Hawaii, which comes out far above the national average with a score of 79.9 years. Massachusetts came not far behind in second place with 79.6, followed by Connecticut in third at 79.2.
In fact, there was a cluster of northeastern and New England states found to be ranked above the U.S. national average, including New York and New Jersey (both 79.0) and Rhode Island and New Hampshire (both 78.5). Maine was the only New England state to fall below the U.S. average, with a life expectancy of 76.7 years. Elsewhere, Minnesota (78.8), California (78.3), Utah (78.2), and Washington (78.2) also came out at the top end of the list.
At the bottom of the table, the state with the lowest life expectancy is Mississippi, which was ranked far below the national average—and almost a full decade behind Hawaii—with a score of 70.9 years; worse still, that figure shows a full year’s decrease in the last five years. West Virginia (71.0) wasn’t far behind in second-to-last place, followed by Alabama (72.0), Louisiana (72.2), and Kentucky (72.3).
Overall, there was a distinct coastal vs. inland divide in the data, as well as a clear distinction in north vs. south. But with life expectancies on the whole continuing to rise year on year, whether these figures change in the years ahead—and if so, by how much—will have to remain to be seen.
Life Expectancy by State from Lowest to Highest
Rank | State | Life Expectancy |
|---|---|---|
51 | Mississippi | 70.9 |
50 | West Virginia | 71 |
49 | Alabama | 72 |
48 | Louisiana | 72.2 |
47 | Kentucky | 72.3 |
46 | Tennessee | 72.4 |
45 | Arkansas | 72.5 |
44 | Oklahoma | 72.7 |
43 | New Mexico | 73 |
42 | South Carolina | 73.5 |
41 | Georgia | 74.3 |
40 | Ohio | 74.5 |
39 | Alaska | 74.5 |
38 | Indiana | 74.6 |
37 | Missouri | 74.6 |
36 | North Carolina | 74.9 |
35 | Wyoming | 75 |
34 | Arizona | 75 |
33 | Nevada | 75.1 |
32 | District of Columbia | 75.3 |
31 | Texas | 75.4 |
30 | Michigan | 75.7 |
29 | Montana | 75.8 |
28 | Kansas | 76 |
27 | Florida | 76.1 |
26 | Delaware | 76.3 |
25 | Pennsylvania | 76.4 |
24 | South Dakota | 76.6 |
23 | Maine | 76.7 |
22 | Virginia | 76.8 |
21 | Illinois | 77.1 |
20 | Idaho | 77.2 |
19 | Maryland | 77.2 |
18 | Oregon | 77.4 |
17 | North Dakota | 77.6 |
16 | Iowa | 77.7 |
15 | Colorado | 77.7 |
14 | Wisconsin | 77.8 |
13 | Nebraska | 77.8 |
12 | Utah | 78.2 |
11 | Washington | 78.2 |
10 | California | 78.3 |
9 | Vermont | 78.4 |
8 | Rhode Island | 78.5 |
7 | New Hampshire | 78.5 |
6 | Minnesota | 78.8 |
5 | New Jersey | 79 |
4 | New York | 79 |
3 | Connecticut | 79.2 |
2 | Massachusetts | 79.6 |
1 | Hawaii | 79.9 |
Discover More Interesting Maps:
