%20%20--%3E%0A%3Csvg%20version%3D%221.1%22%20id%3D%22Layer_1%22%20xmlns%3D%22http%3A%2F%2Fwww.w3.org%2F2000%2Fsvg%22%20xmlns%3Axlink%3D%22http%3A%2F%2Fwww.w3.org%2F1999%2Fxlink%22%20x%3D%220px%22%20y%3D%220px%22%0A%09%20viewBox%3D%220%200%20684.6%2068.1%22%20style%3D%22enable-background%3Anew%200%200%20684.6%2068.1%3B%22%20xml%3Aspace%3D%22preserve%22%3E%0A%3Cg%3E%0A%09%3Cpath%20d%3D%22M444.1%2C29.3h-17.4v14.5h17.4V29.3z%20M36.4%2C68.1l29.3-50.8V0H50.4L32.9%2C36.8L15.5%2C0H0v68.1h16.7V45.8l12.4%2C22.3H36.4z%0A%09%09%20M49.1%2C68.1h16.6V23.4L49.1%2C52.1V68.1z%20M76.6%2C68.1h45V53.8H93.3V41.6h21V27.1h-21V14.8h28.3V0.1h-45V68.1z%20M175.6%2C68.1h17.3v-68%0A%09%09h-16.5v40.3L150%2C0.1h-17.6v68h16.7V27.7L175.6%2C68.1z%20M235.8%2C14.8h15.4V0.1h-47.4v14.7H219v53.2h16.8V14.8z%20M290.3%2C45.9h-17.1%0A%09%09l7.5-15.6h2L290.3%2C45.9z%20M298.7%2C68.1h18l-32.2-68h-5.7l-32%2C68h18l3.3-7.1h27.1L298.7%2C68.1z%20M325.2%2C68.1h46.2V53.8h-29.6V0.1h-16.7%0A%09%09V68.1z%20M423.7%2C14.8h27.2V0.1H407v68h16.7V14.8z%20M462%2C68.1h46.2V53.8h-29.6V0.1H462V68.1z%20M564.8%2C34.1c0%2C10.7-7.2%2C19.2-18.5%2C19.2%0A%09%09c-11.4%2C0-18.5-8.5-18.5-19.2s7.1-19.2%2C18.5-19.2C557.6%2C14.9%2C564.8%2C23.4%2C564.8%2C34.1%20M580.6%2C34.1c0-19-14.2-34-34.3-34%0A%09%09c-20.2%2C0-34.3%2C15-34.3%2C34c0%2C19%2C14.1%2C34%2C34.3%2C34C566.4%2C68.1%2C580.6%2C53.1%2C580.6%2C34.1%20M604.8%2C20.5c0-4.1%2C3.3-6.2%2C6.7-6.2%0A%09%09c4.4%2C0%2C6.6%2C3%2C6.6%2C6.6h14.7C631.8%2C9.1%2C625.1%2C0.1%2C611%2C0.1c-12%2C0-21.7%2C9.3-21.7%2C20.6c0%2C10.9%2C5.9%2C15.9%2C16.7%2C19.8%0A%09%09c5.2%2C1.8%2C11.5%2C3.2%2C11.5%2C8c0%2C3.3-2.4%2C5.5-6.4%2C5.5c-3.6%2C0-6.6-3-6.6-6.7h-15.2c0%2C11.5%2C7.9%2C20.8%2C21.8%2C20.8c12%2C0%2C21.6-9.3%2C21.6-20.6%0A%09%09c0-10-5.3-16.4-16.7-19.8C610.6%2C26.1%2C604.8%2C25.3%2C604.8%2C20.5%20M670%2C20.9h14.7C683.8%2C9.1%2C677.1%2C0.1%2C663%2C0.1c-12%2C0-21.7%2C9.3-21.7%2C20.6%0A%09%09c0%2C10.9%2C5.9%2C15.9%2C16.7%2C19.8c5.2%2C1.8%2C11.5%2C3.2%2C11.5%2C8c0%2C3.3-2.4%2C5.5-6.4%2C5.5c-3.6%2C0-6.6-3-6.6-6.7h-15.2c0%2C11.5%2C7.9%2C20.8%2C21.8%2C20.8%0A%09%09c12%2C0%2C21.6-9.3%2C21.6-20.6c0-10-5.3-16.4-16.7-19.8c-5.4-1.6-11.3-2.4-11.3-7.2c0-4.1%2C3.3-6.2%2C6.7-6.2C667.7%2C14.4%2C670%2C17.3%2C670%2C20.9%0A%09%09%22%2F%3E%0A%3C%2Fg%3E%0A%3C%2Fsvg%3E%0A)
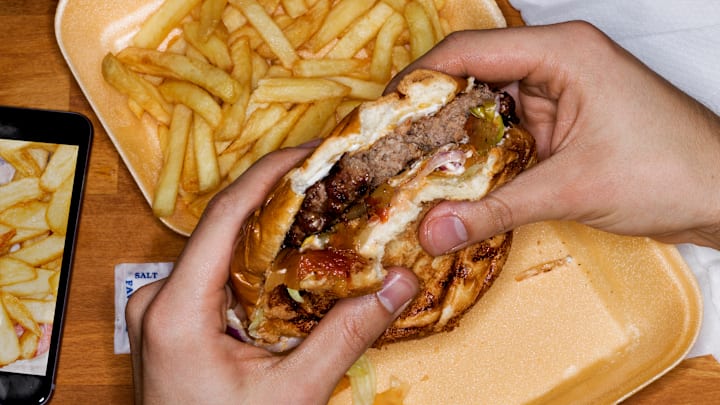
When it comes to grabbing a quick bite, some states make it easier than others. A new analysis reveals where Americans are most surrounded by fast food, and the results may surprise you.
- The 10 States With the Highest Density of Fast Food Restaurants
- What Fast Food Means for Health
- Fast Food Restaurant Density in Every State, Mapped
The 10 States With the Highest Density of Fast Food Restaurants
The research, compiled by QR Code Generator, considered 22 major chains across the country—from Taco Bell and KFC to Chipotle—and compared the number of locations (drawn from the restaurants’ websites as well as restaurant location maps) against population data from the U.S. Census Bureau.
The findings highlight how fast food density varies widely by region, influenced by both population size and local preferences. For residents in these states, quick meals are never far away—whether it’s a sandwich, slice of pizza, or burger.

West Virginia tops the list as the fast food capital of the U.S., with about 49 chain restaurants for every 100,000 residents. The state’s most common spots include Subway, McDonald’s, and Wendy’s, making drive-thru dining an everyday convenience.
Kentucky ranks second, boasting more than 2100 fast food outlets across the state—about 47 for every 100,000 people. Subway dominates there as well, with more than 360 locations, including 52 in Louisville alone. Kansas, which lands in third place, has 165 Pizza Hut restaurants, far outnumbering competitors like Domino’s and Papa Johns combined.
Mississippi and Ohio follow closely, each with more than 46 fast food outlets per 100,000 residents. Ohio stands out for its coffee culture too, ranking ninth in the country for the number of Starbucks locations. Indiana, Arkansas, and Louisiana also make the top 10, with familiar names like McDonald’s, Dairy Queen, Popeyes, and Whataburger shaping local dining habits. Tennessee comes in ninth, bolstered by one of the highest counts of Sonic Drive-Ins nationwide, while Wyoming rounds out the list, thanks in large part to Subway’s dominance.
Rank | State | Total number of fast food restaurants | Total number of fast food restaurants per 100,000 people |
|---|---|---|---|
1 | West Virginia | 868 | 49.04 |
2 | Kentucky | 2137 | 47.21 |
3 | Kansas | 1385 | 47.10 |
4 | Mississippi | 1373 | 46.71 |
5 | Ohio | 5472 | 46.43 |
6 | Indiana | 3182 | 46.37 |
7 | Arkansas | 1417 | 46.19 |
8 | Louisiana | 2077 | 45.41 |
9 | Tennessee | 3187 | 44.72 |
10 | Wyoming | 259 | 44.34 |
What Fast Food Means for Health
Public health experts have long noted the link between fast food access and higher rates of health concerns such as obesity, diabetes, and heart disease.
The CDC’s most recent data shows that states in the South and Appalachia tend to report some of the nation’s highest obesity rates. Several of these states on this list are in those regions—and while correlation doesn’t always mean causation, the overlap shows how fast food access might influence healthy eating choices.
Fast Food Restaurant Density in Every State, Mapped
