%20%20--%3E%0A%3Csvg%20version%3D%221.1%22%20id%3D%22Layer_1%22%20xmlns%3D%22http%3A%2F%2Fwww.w3.org%2F2000%2Fsvg%22%20xmlns%3Axlink%3D%22http%3A%2F%2Fwww.w3.org%2F1999%2Fxlink%22%20x%3D%220px%22%20y%3D%220px%22%0A%09%20viewBox%3D%220%200%20684.6%2068.1%22%20style%3D%22enable-background%3Anew%200%200%20684.6%2068.1%3B%22%20xml%3Aspace%3D%22preserve%22%3E%0A%3Cg%3E%0A%09%3Cpath%20d%3D%22M444.1%2C29.3h-17.4v14.5h17.4V29.3z%20M36.4%2C68.1l29.3-50.8V0H50.4L32.9%2C36.8L15.5%2C0H0v68.1h16.7V45.8l12.4%2C22.3H36.4z%0A%09%09%20M49.1%2C68.1h16.6V23.4L49.1%2C52.1V68.1z%20M76.6%2C68.1h45V53.8H93.3V41.6h21V27.1h-21V14.8h28.3V0.1h-45V68.1z%20M175.6%2C68.1h17.3v-68%0A%09%09h-16.5v40.3L150%2C0.1h-17.6v68h16.7V27.7L175.6%2C68.1z%20M235.8%2C14.8h15.4V0.1h-47.4v14.7H219v53.2h16.8V14.8z%20M290.3%2C45.9h-17.1%0A%09%09l7.5-15.6h2L290.3%2C45.9z%20M298.7%2C68.1h18l-32.2-68h-5.7l-32%2C68h18l3.3-7.1h27.1L298.7%2C68.1z%20M325.2%2C68.1h46.2V53.8h-29.6V0.1h-16.7%0A%09%09V68.1z%20M423.7%2C14.8h27.2V0.1H407v68h16.7V14.8z%20M462%2C68.1h46.2V53.8h-29.6V0.1H462V68.1z%20M564.8%2C34.1c0%2C10.7-7.2%2C19.2-18.5%2C19.2%0A%09%09c-11.4%2C0-18.5-8.5-18.5-19.2s7.1-19.2%2C18.5-19.2C557.6%2C14.9%2C564.8%2C23.4%2C564.8%2C34.1%20M580.6%2C34.1c0-19-14.2-34-34.3-34%0A%09%09c-20.2%2C0-34.3%2C15-34.3%2C34c0%2C19%2C14.1%2C34%2C34.3%2C34C566.4%2C68.1%2C580.6%2C53.1%2C580.6%2C34.1%20M604.8%2C20.5c0-4.1%2C3.3-6.2%2C6.7-6.2%0A%09%09c4.4%2C0%2C6.6%2C3%2C6.6%2C6.6h14.7C631.8%2C9.1%2C625.1%2C0.1%2C611%2C0.1c-12%2C0-21.7%2C9.3-21.7%2C20.6c0%2C10.9%2C5.9%2C15.9%2C16.7%2C19.8%0A%09%09c5.2%2C1.8%2C11.5%2C3.2%2C11.5%2C8c0%2C3.3-2.4%2C5.5-6.4%2C5.5c-3.6%2C0-6.6-3-6.6-6.7h-15.2c0%2C11.5%2C7.9%2C20.8%2C21.8%2C20.8c12%2C0%2C21.6-9.3%2C21.6-20.6%0A%09%09c0-10-5.3-16.4-16.7-19.8C610.6%2C26.1%2C604.8%2C25.3%2C604.8%2C20.5%20M670%2C20.9h14.7C683.8%2C9.1%2C677.1%2C0.1%2C663%2C0.1c-12%2C0-21.7%2C9.3-21.7%2C20.6%0A%09%09c0%2C10.9%2C5.9%2C15.9%2C16.7%2C19.8c5.2%2C1.8%2C11.5%2C3.2%2C11.5%2C8c0%2C3.3-2.4%2C5.5-6.4%2C5.5c-3.6%2C0-6.6-3-6.6-6.7h-15.2c0%2C11.5%2C7.9%2C20.8%2C21.8%2C20.8%0A%09%09c12%2C0%2C21.6-9.3%2C21.6-20.6c0-10-5.3-16.4-16.7-19.8c-5.4-1.6-11.3-2.4-11.3-7.2c0-4.1%2C3.3-6.2%2C6.7-6.2C667.7%2C14.4%2C670%2C17.3%2C670%2C20.9%0A%09%09%22%2F%3E%0A%3C%2Fg%3E%0A%3C%2Fsvg%3E%0A)
There are now almost 1.5 billion cars in the world, of which nearly a fifth—some 278 million—are found in the United States.
In fact, the U.S. has one of the highest rates of car ownership in the world, with only 8 percent of American households recorded as not owning a motor vehicle (compared to the 36 percent that have at least two). Just 6 percent of Americans, meanwhile, claim never to drive at all.
With so many people on the road, it’s probably not surprising that there were a staggering 6 million car crashes are reported in the U.S. in 2023. Many could be put down to unavoidable factors, like mechanical failure or bad weather, but new research by Consumer Affairs has revealed just how many of these collisions are sparked by something far more preventable: road rage.
The study’s authors collected data from traffic incidents and violations and car crashes (including fatal ones) recorded across the United States in which the likes of careless or reckless driving, speeding, and gun violence were contributing factors. This information was then used to rank each state on a normalized scale of 0–100 points, with each one then plotted on a map to reveal which states are the angriest behind the wheel.
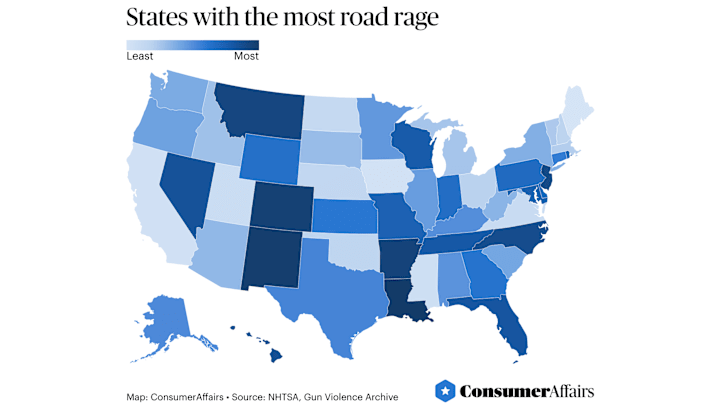
The States With the Worst Road Rage, Mapped

For the second year in a row, Louisiana came out on top in the Consumer Affairs’ road rage study, with a score of 100/100. Around 58 percent of all the state’s traffic deaths were linked to aggressive or reckless driving, setting Louisiana four times above the national average of 14 percent.
In second place, New Mexico scored 89.27/100 and recorded a total of 38 percent of traffic fatalities linked to aggression behind the wheel. Although that figure shows a 20 percent drop from top-place Louisiana, taking a closer look at the stats for New Mexico shows that it has a comparatively high rate of gun-related road violence, with an average of 1.56 gun-related traffic incidents per 100,000 people—almost four times the national average of 0.42 (and more than three times the 0.48 rate recorded in Louisiana).
Colorado came in third place in the study (one place higher than last year) with a score 83.29/100. It too had a higher-than-average rate of gun violence (0.72). As the study’s authors point out, although Colorado may not have the highest rate of traffic fatalities overall, it still recorded the highest number of traffic violations relating to speeding or aggressive and careless driving, with 1.8 offences recorded for every 100,000 people—over eight times the U.S. average of 0.22.
Elsewhere, the remainder of the top 10 consists of Arkansas (82.3/100), Montana (59.29/100), New Jersey (55.43/100), North Carolina (52.67/100), Hawaii (51.18/100), Nevada (45.55/100), and Florida (42.78/100).
The States With the Lowest Road Rage
At the opposite end of the scale, Maine has recorded the lowest rate of road rage in the entire United States—putting it nine places lower than last year—with zeroes all across the board, and a perfect score of 0/100 overall.
It was followed by Iowa (1.42/100), California (3.82/100), Mississippi (5.26/100) and Utah (5.49/100 points). Like Maine, Iowa, Mississippi, and Utah in particular show marked improvements on last year’s ranking: Iowa is down nine places, Utah has fallen 18 places, and Mississippi is now ranked 21 places lower than last year. Only Nebraska (down 25 places), North Dakota (down 25), and Ohio (down 26) showed a better year-on-year improvement in their rankings.
The Complete Ranking

RANKING | STATE |
|---|---|
1 | Louisiana (100/100) |
2 | New Mexico (89.27/100) |
3 | Colorado (83.19/100) |
4 | Arkansas (82.30/100) |
5 | Montana (59.29/100) |
6 | New Jersey (55.43/100) |
7 | North Carolina (52.67/100) |
8 | Hawaii (51.58/100) |
9 | Nevada (45.55/100) |
10 | Florida (42.78/100) |
11 | Tennessee (42.20/100) |
12 | Wisconsin (41.66/100) |
13 | Maryland (39.19/100) |
14 | Missouri (31.44/100) |
15 | Rhode Island (31.10/100) |
16 | Delaware (28.86/100) |
17 | Pennsylvania (28.12/100) |
18 | Indiana (27.49/100) |
19 | Wyoming (27.08/100) |
20 | Georgia (26.33/100) |
21 | Kansas (26.17/100) |
22 | Connecticut (24.77/100) |
23 | Washington, D.C. (24.31/100) |
24 | Texas (23.57/100) |
25 | Alaska (22.65/100) |
26 | Kentucky (20.66/100) |
27 | Alabama (19.87/100) |
28 | Minnesota (17.28/100) |
29 | Illinois (16.56/100) |
30 | Oregon (16.53/100) |
31 | South Carolina (16.53/100) |
32 | Washington (16.26/100) |
33 | New York (16.25/100) |
34 | West Virginia (15.9/100) |
35 | Arizona (15.16/100) |
36 | South Dakota (15.12/100) |
37 | Idaho (13.72/100) |
38 | Michigan (13.43/100) |
39 | Vermont (13.07/100) |
40 | Massachusetts (12/100) |
41 | Ohio (11.06/100) |
42 | New Hampshire (10.8/100) |
43 | Oklahoma (9.91/100) |
44 | Nebraska (9.01/100) |
45 | North Dakota (9/100) |
46 | Virginia (5.72/100) |
47 | Utah (5.49/100) |
48 | Mississippi (5.26/100) |
49 | California (3.82/100) |
50 | Iowa (1.43/100) |
51 | Maine (0/100) |
For more on the study, these rankings, an interactive map, and how these figures were compiled, head over to the Consumer Affairs website.
Discover More Fascinating Maps: