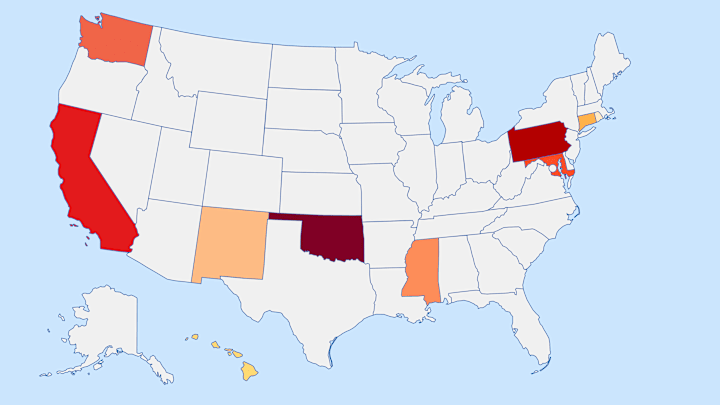
Whether you’re making your daily commute to work or going on a trip, road conditions make all the difference. Nowhere offers perfectly smooth drives 100 percent of the time, but there are definitely places that are worse off than the rest. We did some digging to find out which states have the worst and best road conditions.
Using data from the Bureau of Transportation Statistics, we found the most recent nationwide information (from 2023) on road quality by state. The lists and maps below account for the condition of each state’s total road mileage as assessed by the International Roughness Index (IRI), a global standard used by highway professionals to evaluate road quality. The IRI helps determine each state’s percentage of roadway miles deemed “acceptable” for driving.
It’s Smooth Sailing in These States

According to the Bureau of Transportation Statistics, Indiana’s road conditions are the best in the U.S., with the percentage of acceptable roads reaching 97.38 percent in 2023. The state rose to the top spot after finishing second the previous year. Kansas follows, jumping up from the fourth spot in 2022. South Dakota made the most significant improvement—it moved from the 20th position in 2022 to third place in 2023.
These were the top 10 states with the best roads in 2023:
State | Percentage of Acceptable Roadways |
|---|---|
Indiana | 97.38 |
Kansas | 96.19 |
South Dakota | 95.1 |
Wyoming | 94.88 |
Vermont | 94.85 |
Tennessee | 94.05 |
Idaho | 93.77 |
Georgia | 93.51 |
North Dakota | 93.33 |
Nebraska | 92.61 |
You May Also Like:
- Mapped: The States With the Worst Road Rage
- The 5 Easiest States for Drivers to Navigate
- 10 of the Most Dangerous Road Trips in the U.S.
Add Mental Floss as a preferred news source!
These States Are in for a Bumpy Ride

On the other end of the spectrum, Rhode Island and Hawaii had the worst road conditions in 2023, with 55.25 percent and 60.91 percent of roads there deemed acceptable, respectively. The two states switched positions in 2022. In third place is New Mexico, which retained its position from the previous year.
The roads in these states could use some work:
State | Overall Percentage Acceptable |
|---|---|
Rhode Island | 55.25 |
Hawaii | 60.91 |
New Mexico | 67.03 |
Connecticut | 70.03 |
Mississippi | 70.15 |
Washington | 70.37 |
Maryland | 71.28 |
California | 71.96 |
Pennsylvania | 72.63 |
Oklahoma | 73.12 |
No matter where in the U.S. you’re driving, it helps to be aware of common road hazards. Here are some common examples and the best ways to react to them.
